 eAtlas Data Catalogue
Institute for Marine and Antarctic Studies (IMAS)
Type of resources
Topics
Keywords
Contact for the resource
Provided by
Years
Representation types
Update frequencies
status
-
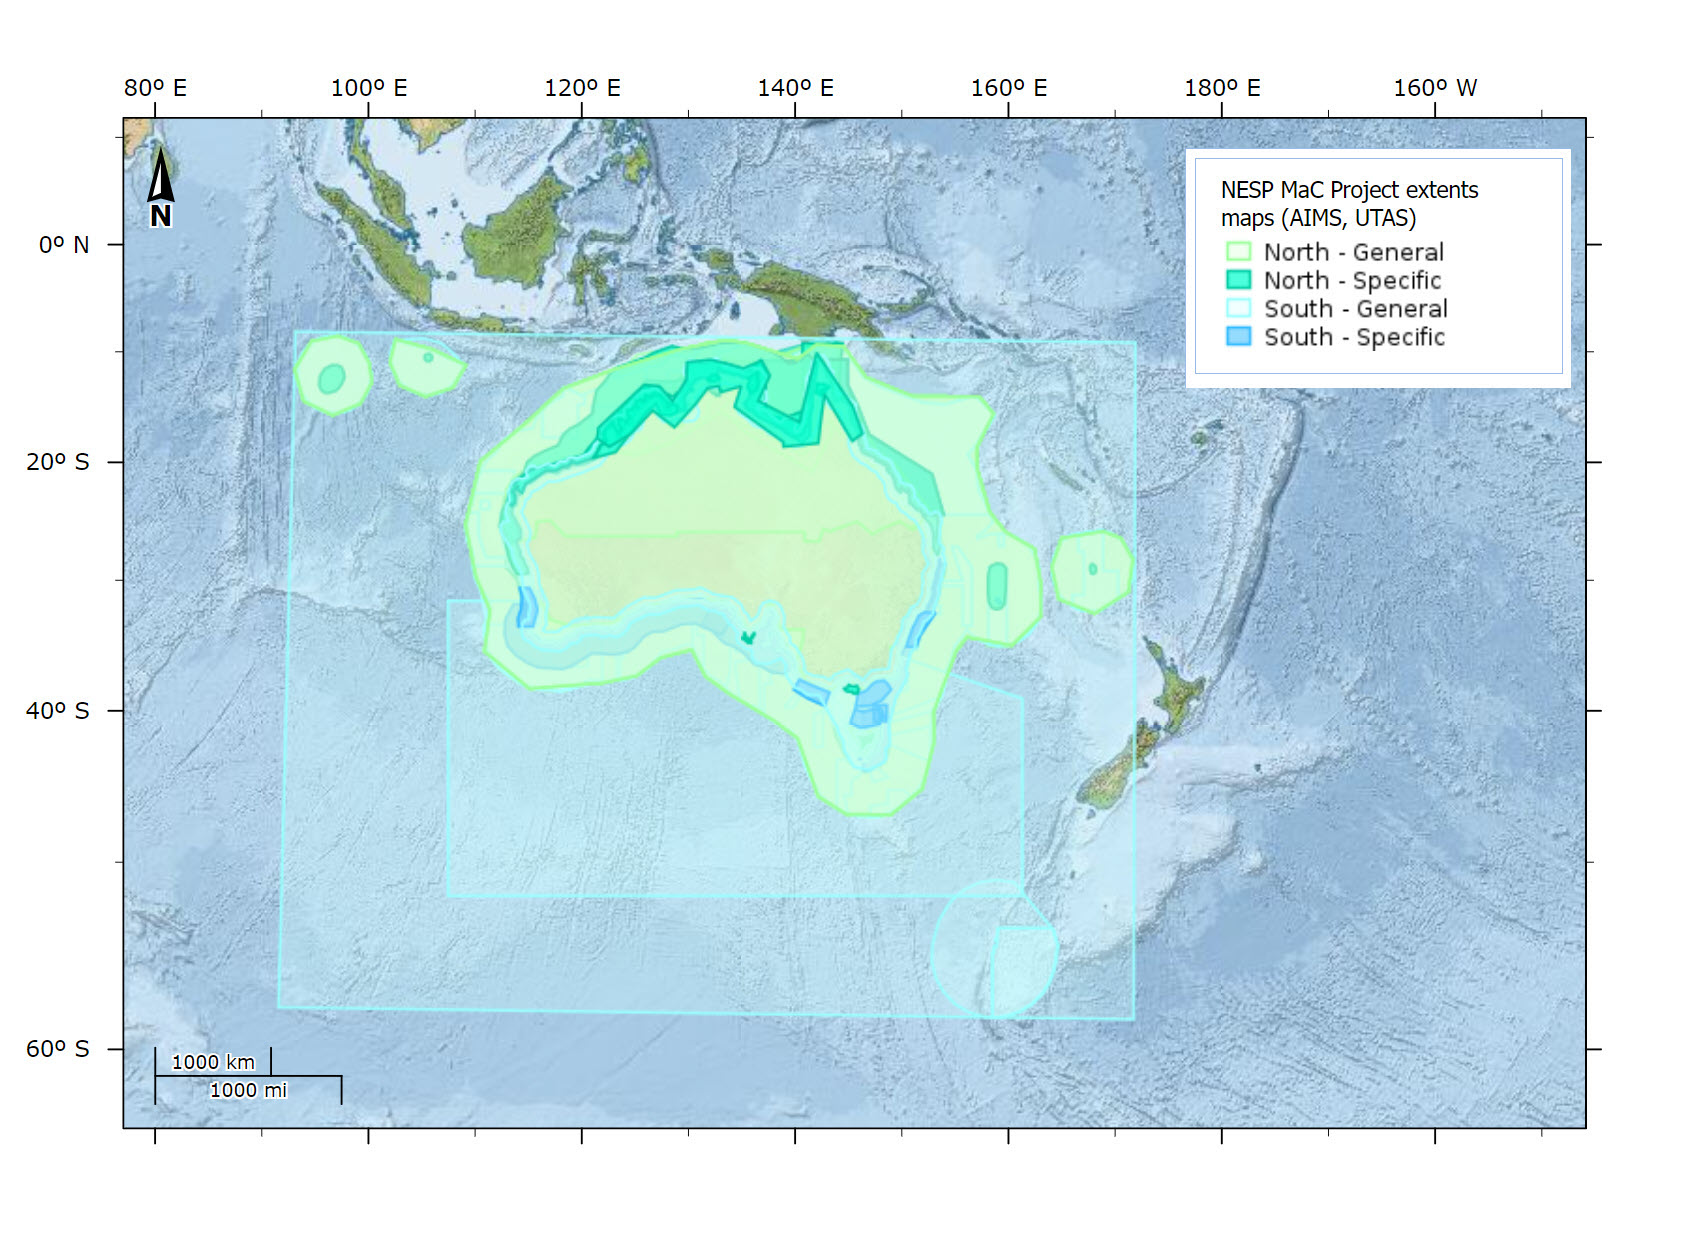
This dataset contains 63 shapefiles that represent the areas of relevance for each research project under the National Environmental Science Program Marine and Coastal Hub, northern and southern node projects for Rounds 1, 2 & 3. Methods: Each project map is developed using the following steps: 1. The project map was drawn based on the information provided in the research project proposals. 2. The map was refined based on feedback during the first data discussions with the project leader. 3. Where projects are finished most maps were updated based on the extents of datasets generated by the project and followup checks with the project leader. The area mapped includes on-ground activities of the project, but also where the outputs of the project are likely to be relevant. The maps were refined by project leads, by showing them the initial map developed from the proposal, then asking them "How would you change this map to better represent the area where your project is relevant?". In general, this would result in changes such as removing areas where they were no longer intending research to be, or trimming of the extents to better represent the habitats that are relevant. The project extent maps are intentionally low resolution (low number of polygon vertices), limiting the number of vertices 100s of points. This is to allow their easy integration into project metadata records and for presenting via interactive web maps and spatial searching. The goal of the maps was to define the project extent in a manner that was significantly more accurate than a bounding box, reducing the number of false positives generated from a spatial search. The geometry was intended to be simple enough that projects leaders could describe the locations verbally and the rough nature of the mapping made it clear that the regions of relevance are approximate. In some cases, boundaries were drawn manually using a low number of vertices, in the process adjusting them to be more relevant to the project. In others, high resolution GIS datasets (such as the EEZ, or the Australian coastline) were used, but simplified at a resolution of 5-10km to ensure an appopriate vertices count for the final polygon extent. Reference datasets were frequently used to make adjustments to the maps, for example maps of wetlands and rivers were used to better represent the inner boundary of projects that were relevant for wetlands. In general, the areas represented in the maps tend to show an area larger then the actual project activities, for example a project focusing on coastal restoration might include marine areas up to 50 km offshore and 50 km inshore. This buffering allows the coastline to be represented with a low number of verticies without leading to false negatives, where a project doesn't come up in a search because the area being searched is just outside the core area of a project. Limitations of the data: The areas represented in this data are intentionally low resolution. The polygon features from the various projects overlap significantly and thus many boundaries are hidden with default styling. This dataset is not a complete representation of the work being done by the NESP MaC projects as it was collected only 3 years into a 7 year program. Format of the data: The maps were drawn in QGIS using relevant reference layers and saved as shapefiles. These are then converted to GeoJSON or WKT (Well-known Text) and incorporated into the ISO19115-3 project metadata records in GeoNetwork. Updates to the map are made to the original shapefiles, and the metadata record subsequently updated. All projects are represented as a single multi-polygon. The multiple polygons was developed by merging of separate areas into a single multi-polygon. This was done to improve compatibility with web platforms, allowing easy conversion to GeoJSON and WKT. This dataset will be updated periodically as new NESP MaC projects are developed and as project progress and the map layers are improved. These updates will typically be annual. Data dictionary: NAME - Title of the layer PROJ - Project code of the project relating to the layer NODE - Whether the project is part of the Northern or Southern Nodes TITLE - Title of the project P_LEADER - Name of the Project leader and institution managing the project PROJ_LINK - Link to the project metadata MAP_DESC - Brief text description of the map area MAP_TYPE - Describes whether the map extent is a 'general' area of relevance for the project work, or 'specific' where there is on ground survey or sampling activities MOD_DATE - Last modification date to the individual map layer (prior to merging) Updates & Processing: These maps were created by eAtlas and IMAS Data Wranglers as part of the NESP MaC Data Management activities. As new project information is made available, the maps may be updated and republished. The update log will appear below with notes to indicate when individual project maps are updated: 20220626 - Dataset published (All shapefiles have MOD_DATE 20230626) Location of the data: This dataset is filed in the eAtlas enduring data repository at: data\\custodian\nesp-mac-3\AU_AIMS-UTAS_NESP-MaC_Project-extents-maps